Now that I've finished preparing the data, it's time to build the model!
I chose to try sklearn's support vector machine and random forest, as well as xgboost because predicting college tuition should be a relatively simple task. To find the best model, I used sklearn's GridSearchCV to brute force the parameters for each model. GridSearchCV takes the model (in this case a support vector regressor), a parameter grid (7*5*7=245 total combinations), a scoring method (regression so I'll use mean squared error), and number of folds for cross validation.
model = svm.SVR()
grid_values = {'gamma': [0.01, 0.03, 0.1, 0.3, 1, 3, 9],
                'C': [0.1, 0.3, 1, 3, 9],
                'epsilon': [0.001, 0.003, 0.01, 0.03, 0.1, 0.3, 1]}
grid_search = GridSearchCV(model, param_grid=grid_values, n_jobs=-1, scoring='neg_mean_squared_error', cv=3)
grid_search.fit(X_train, y_train)
Using GridSearchCV is similar for a random forest regressor and xgboost regressor, but it takes a different parameter grid. Here are the results:
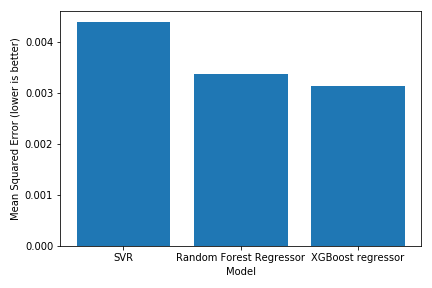
A bar graph comparing the results of the models
Unsurprisingly, the xgboost model did the best, followed by random forest and SVR. Here is a scatterplot of the xgboost model predicting on the test set:
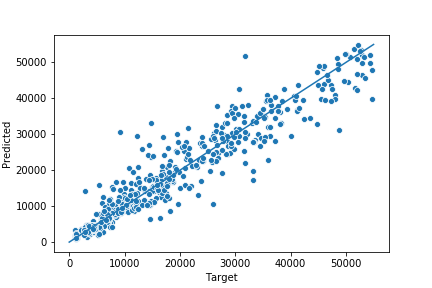
A scatterplot of targets vs predictions
Visualizing the plot confirmed my hypothesis that the model would do best at lower tuition amounts. With xgboost, I can retrieve the feature importance and plot it as well.
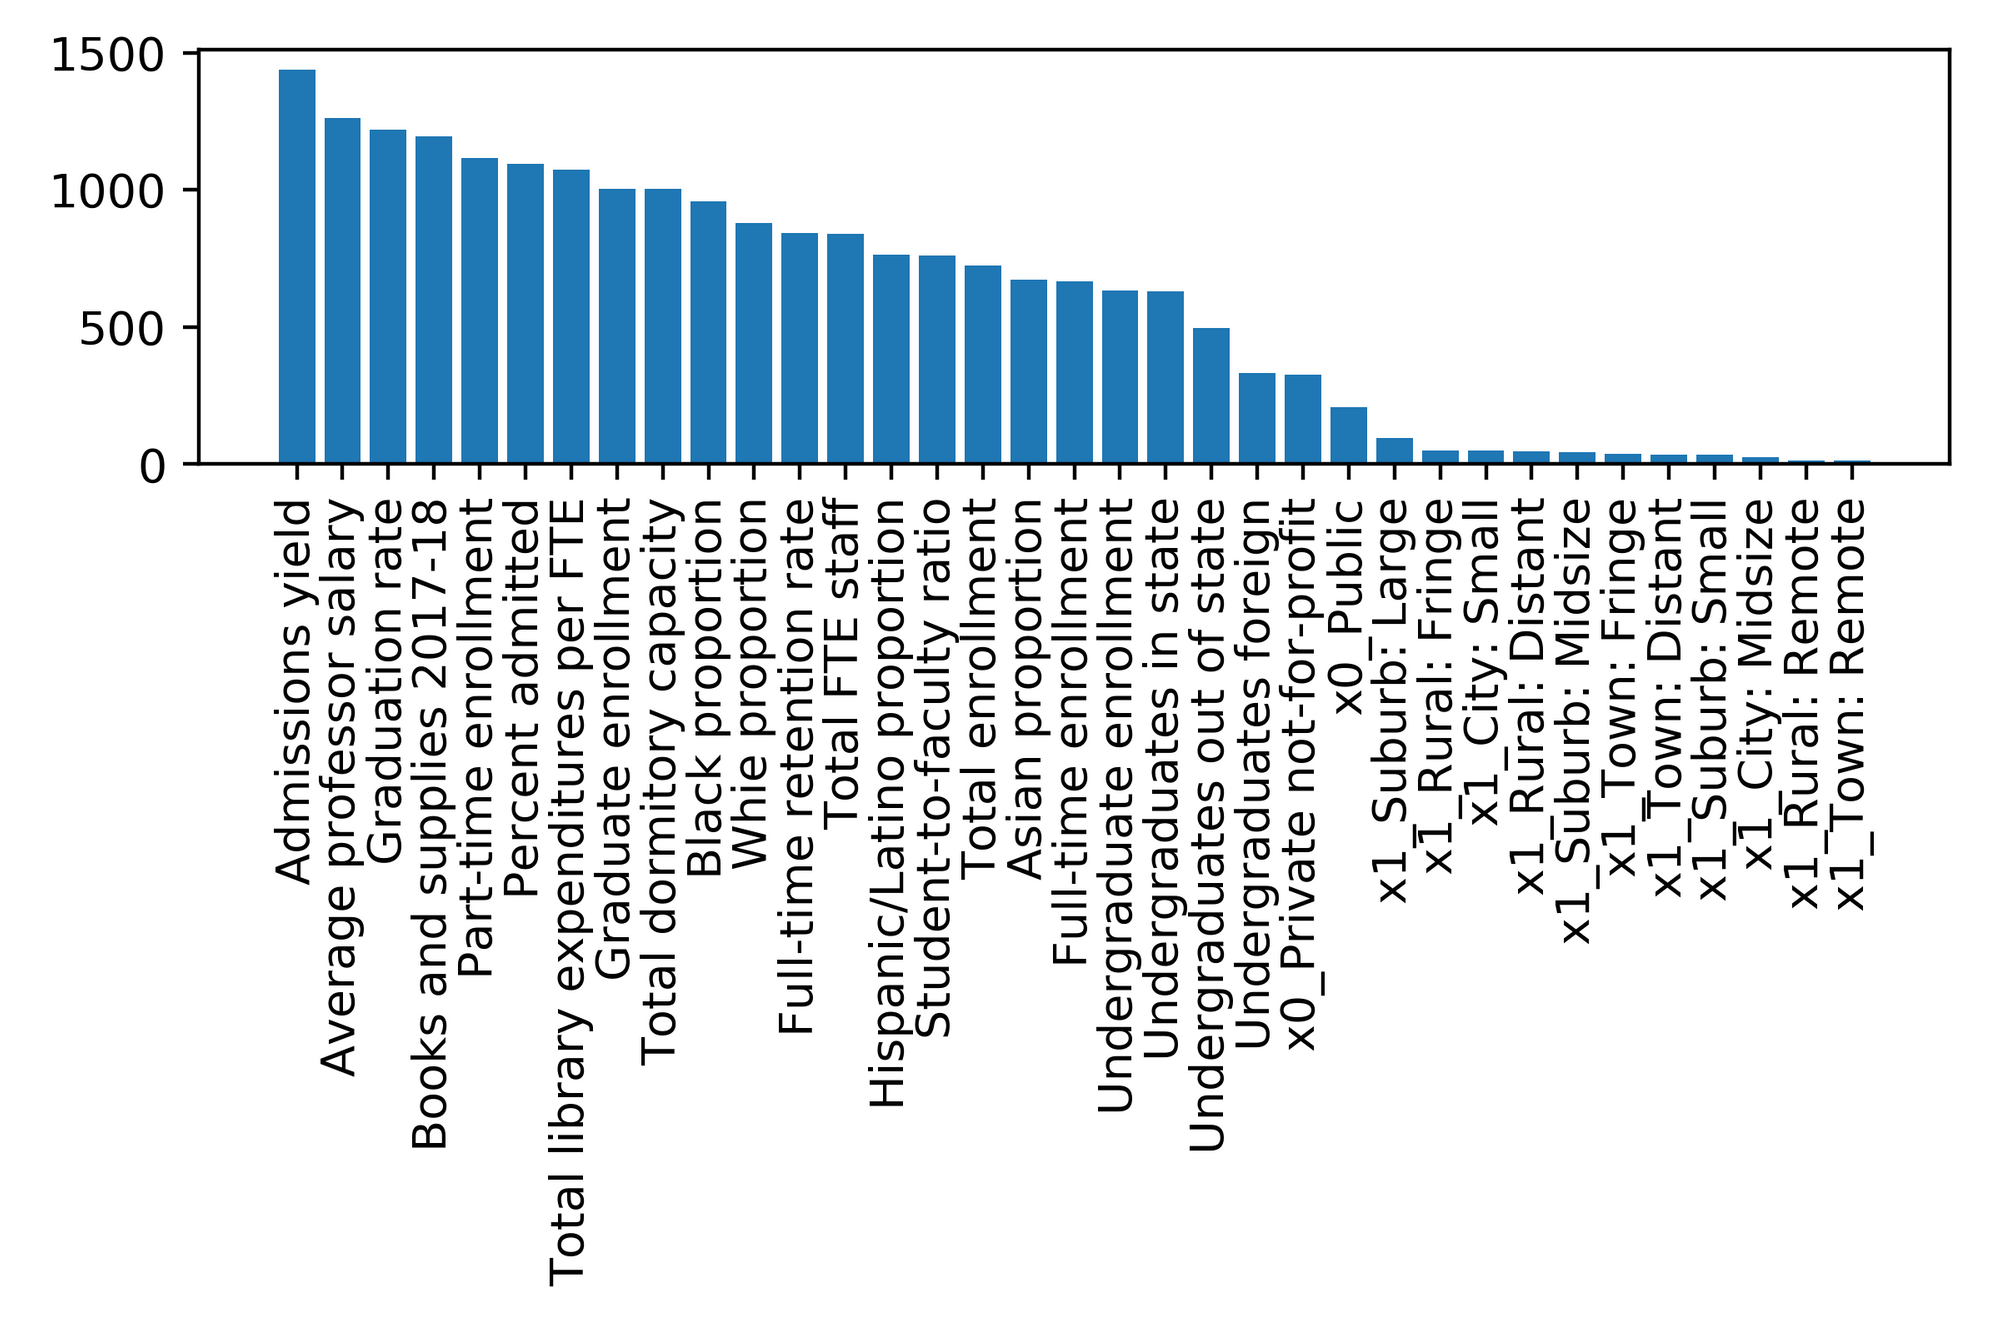
Feature importance graph
Admissions yield and professor salary contributed the most, while my categorical features regarding college size and location provided little predictive power.
Full code is located over on my GitHub.